Even with Ethereum’s strong run where the coin has reached near $4k, on-chain data shows there is still more room for the bull rally to continue.
Ethereum All Exchanges Taker Buy Sell Ratio Shoots Up
As pointed out by a CryptoQuant post, the ETH all exchanges taker buy sell volume has shown a huge spike today.
The Ethereum all exchanges taker buy sell ratio (or volume) is an indicator that shows the ratio between long volume and the taker seller volume.
Now, common sense says, since every trade needs a buyer and a seller, how can there exist a difference between the two quantities?
Well, to understand the concept of taker buy and sell volumes, the idea of taker and maker needs to be understood first. Quoting the CryptoQuant data guide:
Taker: Taker trade refers to an order that is traded before going on the order book. All market order trades are takers.
Maker: Maker trade refers to an order that goes on the order book (e.g. a limit order). These orders add volume to the order book, helping to ‘make the market’.
When these takers buy ETH at the price set by makers, the amount of coins traded contributes to the taker seller volume. This volume is referred to as “seller” because it can drive the prices down.
Related Reading | Why Bitcoin And Ethereum Could Be In Trouble As Derivatives Pressure Mounts
On the other hand, takers selling to makers at the ask price can push the prices up, thus contributing to the buyer volume.
The ratio between these two volumes is precisely the taker buy-sell ratio. If the taker buy volume is higher than the sell volume (that is, the value of indicator is above one), it means more trades are occurring at the ask price. This shows there is more demand and so the prices go up.
Related Reading | As Bitcoin Breaks $50k, Indicators Show A Calm Before The Storm
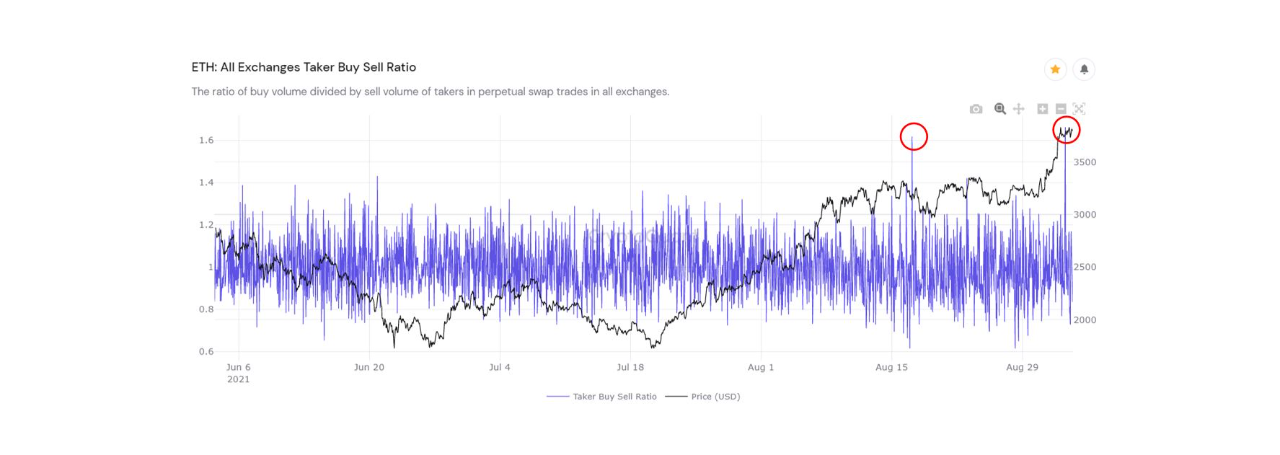
Now, here is a chart that shows how the value of this metric looks like for Ethereum right now:

The ETH metric spikes up | Source: CrytpoQuant
A high value of the indicator such as right now suggests the Ethereum taker buy volume is greatly overwhelming the sell volume.
A similar spike was seen in the middle of August, and the price moved up in response. So, if the indicator is to be believed, the current high value might also result in further movement upwards.
ETH Price
At the time of writing, Ethereum floats just under $4k, up 22% in the last seven days. Monthly gains for the coin are around 47%.
The below chart shows the trends in ETH’s value over the last three months.

Ethereum's price very sharply moves up as the crypto aims to test $4k | Source: ETHUSD on TradingView
