Bitcoin plunged below $30,000 for the first time in eleven months, as bears continued to run rampant in crypto markets. This move came as Luna Foundation Guard was said to be liquidating close to $1.5 billion worth of BTC. Ethereum also fell to multi-month lows, as prices hovered slightly above $2,200.
Bitcoin
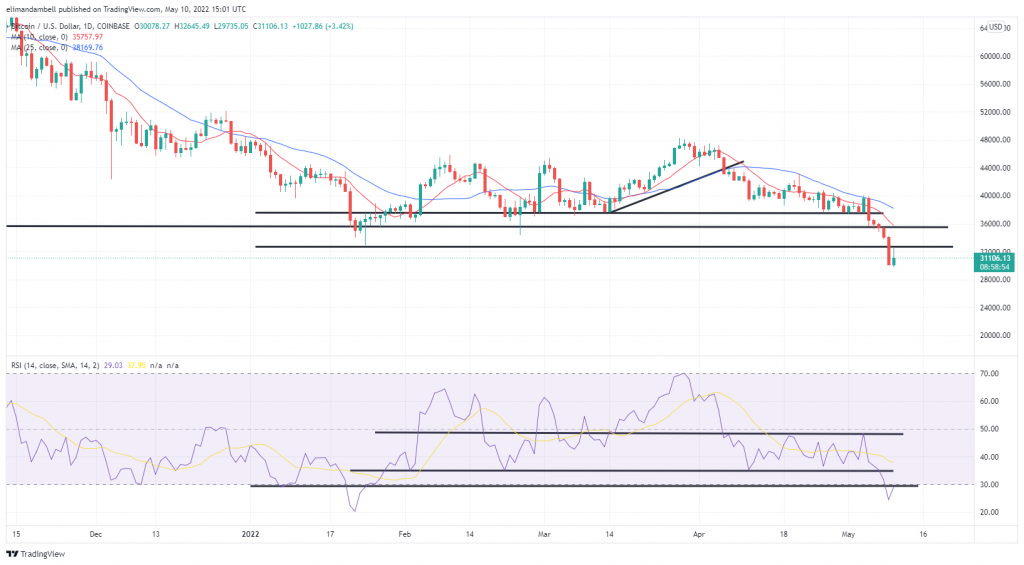
Bitcoin fell for a seventh consecutive session, as markets reacted to the news that the Luna Foundation Guard was to deploy $1.5 billion of BTC, as it hoped to regain its $1 UST peg.
The latest decline in BTC/USD saw prices hit an intraday low of $29,944.80 earlier in today’s session, following a peak of $33,312.81 on Monday.
Today’s bottom is the lowest level prices have traded since June 2021, and comes as an increase of bearish pressure led to the $31,625 support point being broken.

Overall, BTC is now trading around 55% lower than its record high in November, with some optimistic that the worst of the selloff has passed.
Looking at the chart, the 14-day RSI is now tracking off the charts at a level of 32, which is close to its lowest level since February.
It is still unclear if we have hit a floor, with $29,500 a potential candidate for price support following the recent drop in value.
Should this be the case, we will likely see a period of consolidation prior to any significant bullish rebounds.
Ethereum
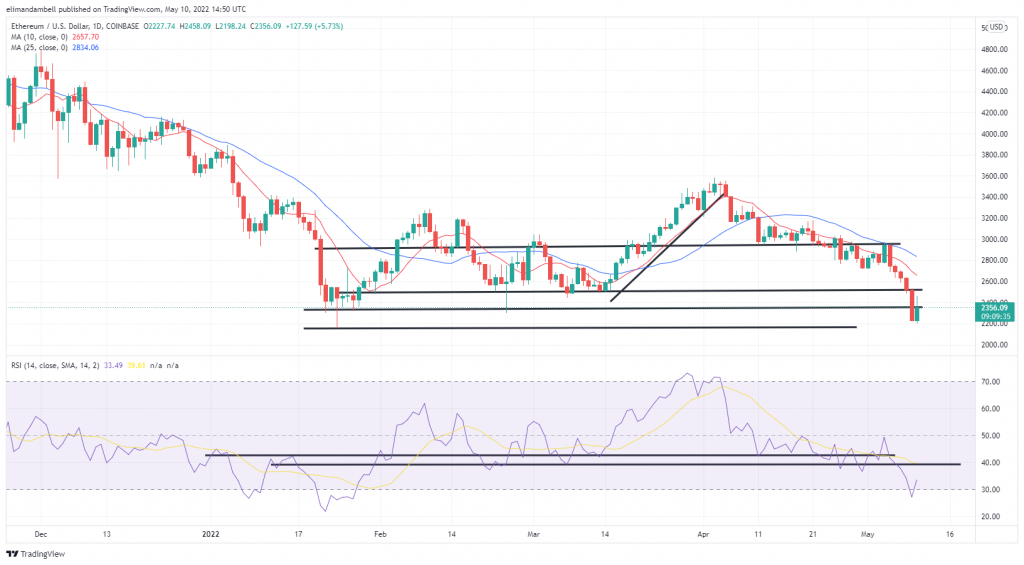
The world’s second-largest cryptocurrency also fell during today’s session, dropping below $2,300 for the first time since January.
ETH/USD hit an intraday low of $2,206.76 earlier on Tuesday, which is its lowest level since January 24, when prices went on to hit a floor of $2,150.
This latest drop comes as yesterday’s support point of $2,350 gave way, following a six-day losing streak.

As of writing, the 14-day Relative Strength Index is reading off the charts, close to a three-month bottom.
Typically, with prices so oversold, traders would likely look at this as an opportunity to buy the dip, however as markets continue to reassess risk assets following the Fed’s rate decision, this may not be the case immediately.
Overall, crypto markets are down by 2.70% as of writing.
Do you believe ETH could go below $2,000 this week? Leave your thoughts in the comments below.
Image Credits: Shutterstock, Pixabay, Wiki Commons
Disclaimer: This article is for informational purposes only. It is not a direct offer or solicitation of an offer to buy or sell, or a recommendation or endorsement of any products, services, or companies. Bitcoin.com does not provide investment, tax, legal, or accounting advice. Neither the company nor the author is responsible, directly or indirectly, for any damage or loss caused or alleged to be caused by or in connection with the use of or reliance on any content, goods or services mentioned in this article.
Read disclaimer
