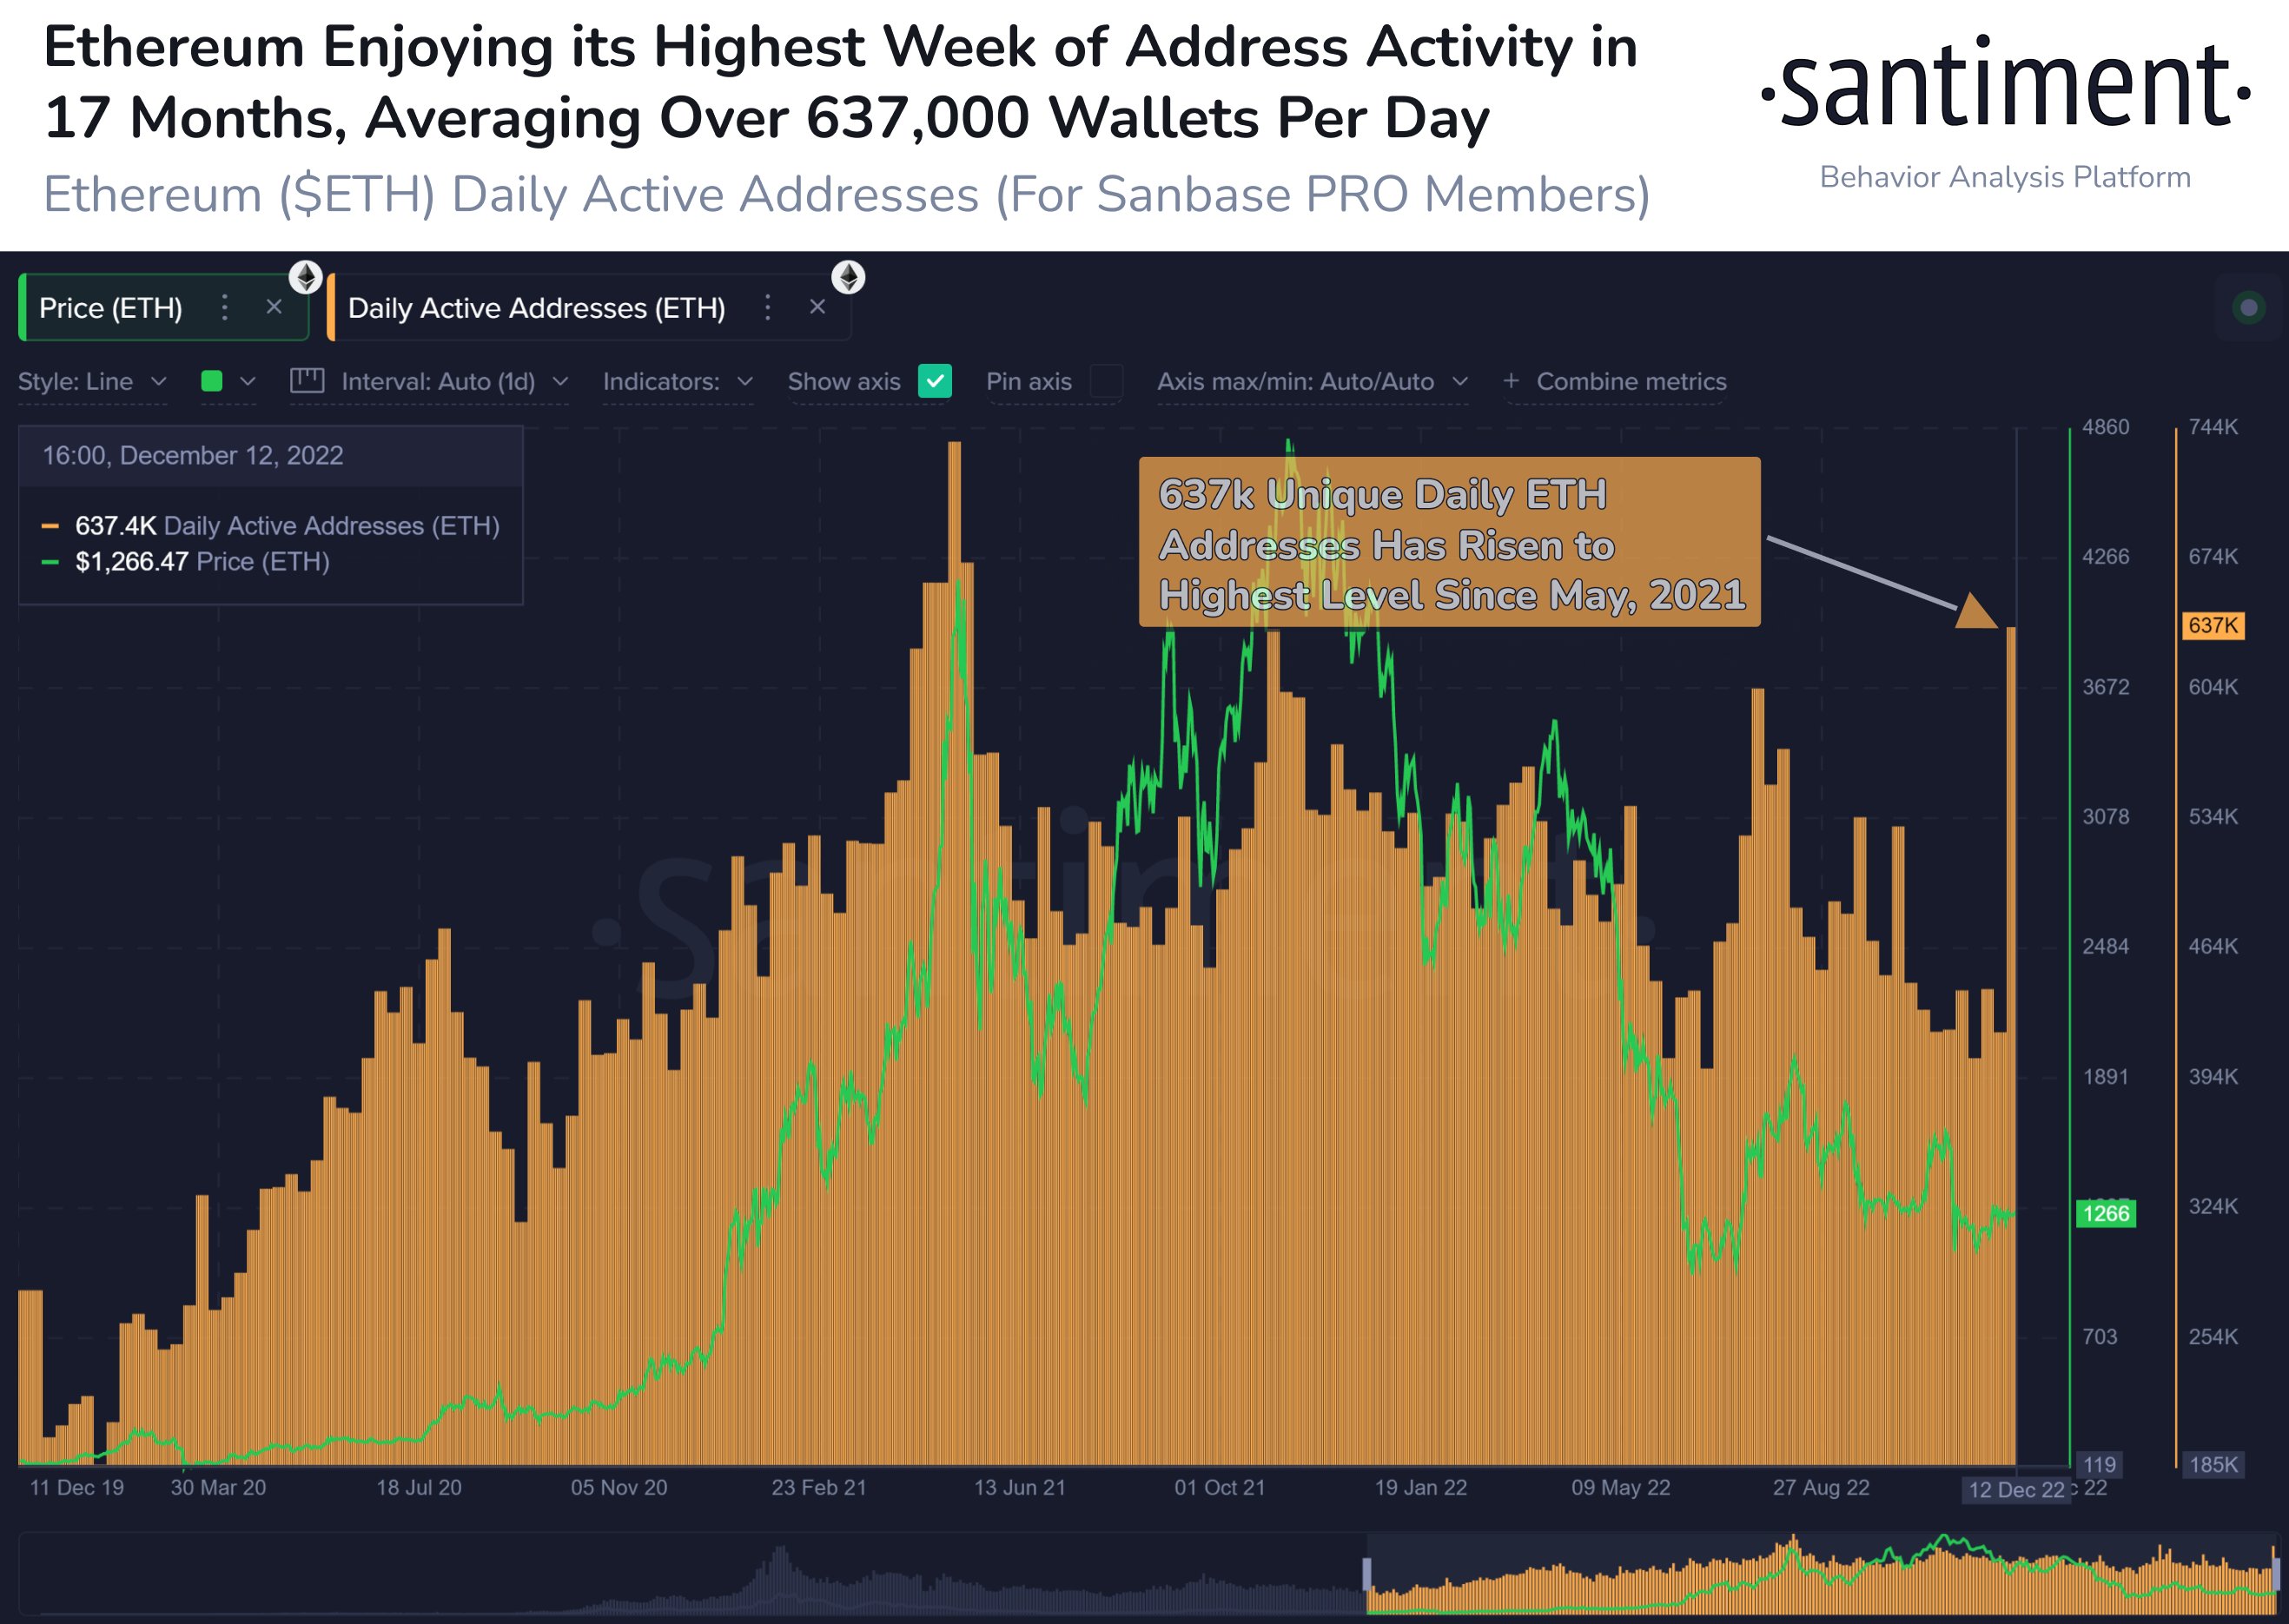
On-chain data shows the Ethereum daily active addresses metric is now at the highest level since May 2021, a sign that could be positive for the latest rally above $1,300.
637,000 Unique Ethereum Addresses Have Been Showing Daily Activity Recently
According to data from on-chain analytics firm Santiment, ETH is currently observing its highest point of activity in 17 months. The “daily active addresses” is an indicator that measures the total number of Ethereum addresses that were involved as a sender or as a receiver on any given day.
When the value of this metric is high, it means traders are active on the network right now. On the other hand, low values suggest investors have been showing little activity during the past day.
The chart below shows the trend in the Ethereum daily active addresses over the last few years:
The value of the metric seems to have been pretty high in recent days | Source: Santiment on Twitter
As the above graph displays, the Ethereum daily active addresses have spiked up during the past week or so. In this period of increased activity, an average of 637,000 ETH addresses have been involved in some coin movement every day. The last time the network saw holders being so lively was back in May of last year when the bull run of the first half of 2021 observed its peak of around $4,300
Usually, high daily active addresses mean that the investors are interested in trading ETH at the moment. Thus, it’s natural that profit-taking opportunities like the May 2021 peak see huge bursts of activity as a large number of holders move their coins for selling purposes.
While it’s true that such activity can be bearish for the asset’s price in this way, it’s also a fact that any rally requires a large number of traders to be sustainable. Ethereum has been rallying during the last couple of days while the active addresses have been very high, suggesting that there are many interested buyers in the market right now. This could be a sign that unlike the rally efforts earlier in this bear market, which didn’t see any activity on such levels, the latest price rise may have enough fuel backing it.

Looks like the value of the asset has sharply gone up during the last two days | Source: ETHUSD on TradingView
At the time of writing, Ethereum’s price floats around $1,300, up 8% in the last week. Over the past month, the cryptocurrency has gained 10% in value. The above chart shows the trend in the price of the coin over the last five days.

